
PerformanceBridge Practice
Imaging department continuous performance improvement through tailored assessments, targeted recommendations, and ongoing monitoring and partnership.
Data and expertise tailored to deliver results
Part of the PerformanceBridge Solutions, PerformanceBridge Practice, is designed to make your performance, utilization and workflow data perform for you in tangible ways that deliver measurable outcomes. We dive deep into your organization to define, develop and implement enterprise-level solutions that create value beyond the individual imaging system or modality.
Our PerformanceBridge Practice offering includes:
Our approach and methodology
Our integrated approach includes a customized assessment to evaluate and benchmark your operational and financial performance. We combine on-site, qualitative data collection with a comprehensive software platform to integrate data streams from multiple sources inside and outside of imaging.
We work with you to set specific performance indicators and develop prioritized recommendations for continuous operational improvement.

Diving deep into your data and organization to:

Working together to:

Partnering over the long term to:
Structured to adapt and scale to your needs
| PerformanceBridge Practice Services | Lite assessement | Deep assessment | Subscription |
| Engagement level | One-time analysis and reporting (4 weeks) | One-time analysis plus detailed recommendations (12 weeks) | Ongoing, integrated engagement with dedicated solution advisor |
| Utilization review | | | |
| Network and market analysis | | | |
| Growth plan | | | |
| ROI calculator | | | |
| Practice management tool | |  | |
| Solution advisor | | | |
A tailored offering based on your needs
PerformanceBridge Practice offers a tailored combination of hardware and software technology and analytics, with on-site professional or consulting services to meet your needs and drive sustained and continuous improvement throughout your organization—all based on co-defined objectives and benchmarks.
Utilization review
Review of efficiency, modality and staff utilization at modality and department level
Network and market analysis
Analysis of referral network, inclusive of market share and exam volumes, in Primary Service
+ analyses by individual room, machine and technologist productivity, with root cause analysis
+ measured by physician and patient leakage, as well as network segmentation
Growth plan
Development of basic market growth and technology management plan, based on installed base and equipment age
ROI calculator
Identification of value drivers and cost savings associated with performance recommendations
+ estimated outpatient, primary and secondary service areas, projected growth in imaging services by modality, and predictive analysis of patient and procedure volumes
+ and efficiency improvements, as well as revenue enhancements from new patient growth and reduced leakage
Solution Advisor
Support from a dedicated solution advisor who collaborates with you to enable continuous improvement and drive business impact of performance improvement projects
Practice management tool
Access to our practice management tool software, providing vendor-agnostic analysis with tailored dashboards, scheduled template reports, notifications and drill-downs for root cause and gap analyses
PerformanceBridge Practice in action
Per capita cost reduction
Challenge
Highly variable imaging exams make optimal scheduling problematic and longer exams drive up operational costs.
Method
Identified target protocols by looking at volume and durations, and utilized machine log files to obtain accurate information.
Impact*
*Results are specific to the institution where they were obtained and may not reflect the results achievable at other institutions.”
Establishing data confidence
Challenge
Imaging departments have a wealth of data sources, yet each gives differing views; this makes it difficult to derive meaningful information without establishing a ground truth and data consistency.
Method
Deployed a network listener to capture HL7 and DICOM. Aggregated and reconciled data from RIS, PACS, EMR, and workflow engine with triangulated output.
Impact
Identified and addressed root causes for data discrepancies; established meaningful metrics for specific departmental performance indicators. Streamlined reporting approach across managers and reduced reporting time.
Ensuring consistent patient care through follow-up
Challenge
Patients have clinical findings leading to a follow-up recommendation, yet there isn’t a mechanism to know if follow-up typically occurs.
Method
Deployed natural language processing tools and intelligence to examine 4.5 years of historic reports across the system.
Impact
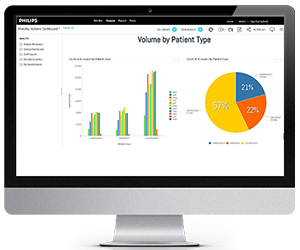
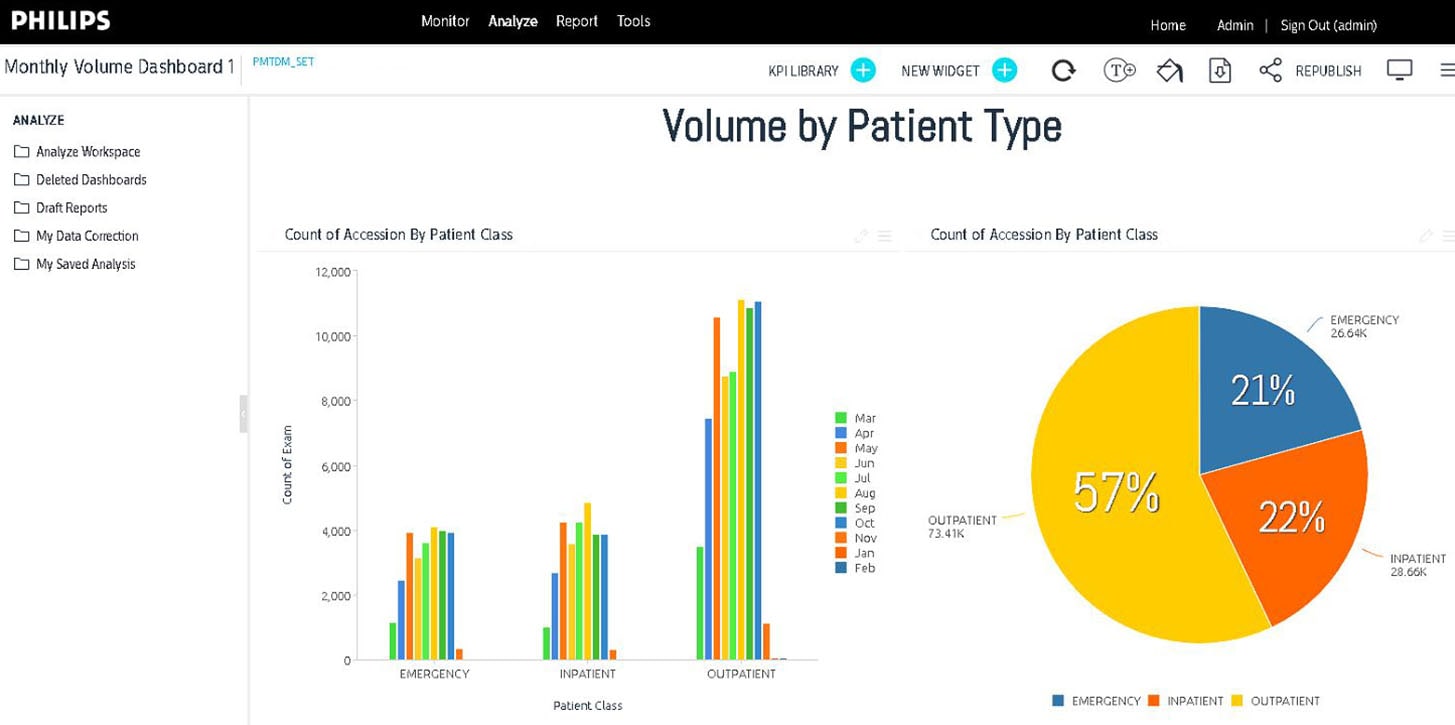
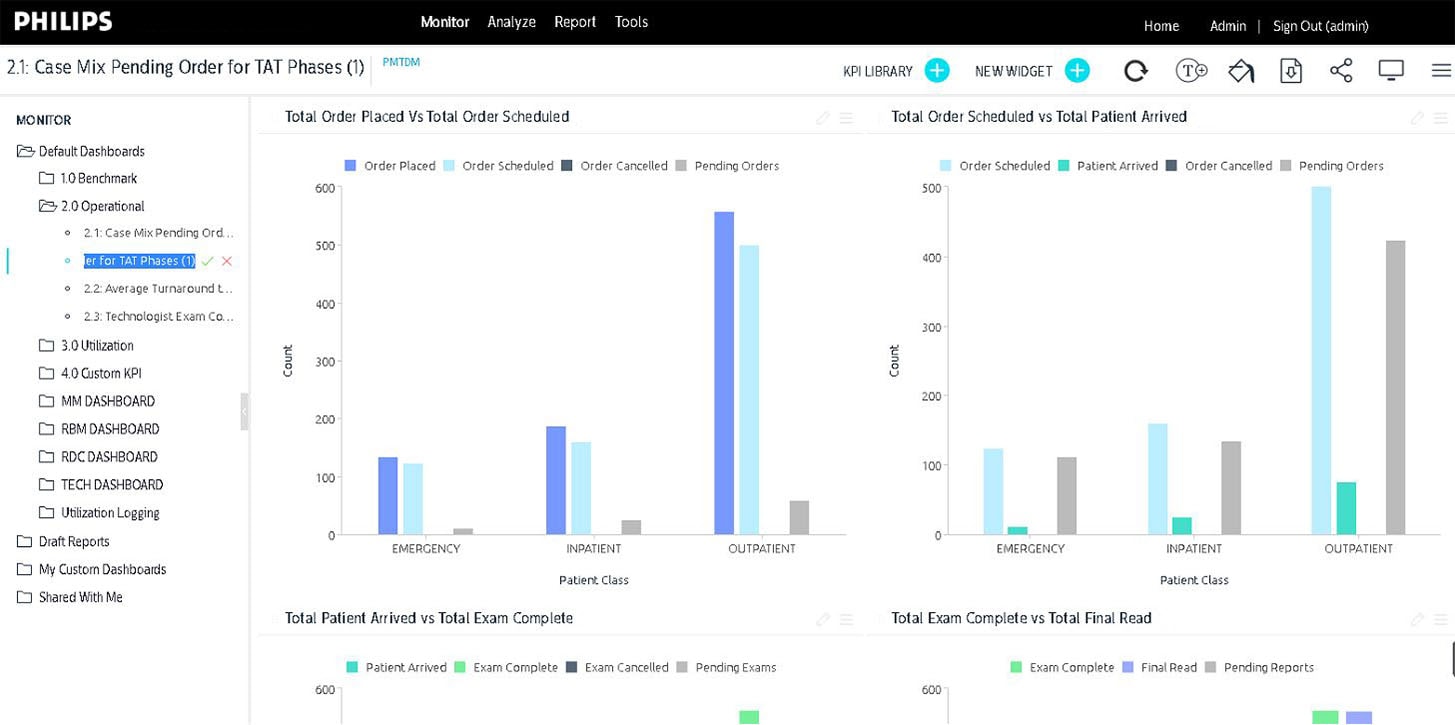
Get insights optimized for action


A look inside our practice management tool

Related Services
-

PerformanceBridge
PerformanceBridge is an integrated, scalable portfolio of services, tools and support enabling hospital departments to improve their performance and build a program for continuous improvement over time.